Gap-up Long Set-Up
Watch closely the last 30 min before the open
and make a solid plan on each ticker.
Answer questions on each of these
·
Daily Chart – What does look like? Uptrend, downtrend or
consolidation?
·
Entry - Is it near support level?
·
Exit - Where the next resistance level and what
is the range?
·
Indicators - What are Vwap and emas doing?
·
Have two plans for each ticker as follows:
1. Pops
at the open
Wait for the
price to pullback to a price support level/emas/vwap. Look for a bullish
reversal candle or wicks or Hammer).
2.
Sells
off at the open
Wait for the
price to settle down on a support level. Most likely the emas/vwap0 will be
above price. So the set-up to look for is the “Bullish Hook Reversal” set-up and look for high low to enter.
Best entry
should be a close above 9 and Vwap. But if it makes higher lows, enter on the
second higher low for best r/r
Illustrations:
05/09/2016 - Gapper Scan on Trade Ideas came up with HZNP.
Answer the questions -
Daily Chart - This was in a
downtrend so what is the next plan? Bias Long yes. (This is the only set-up you are focusing on) But look for next resistance point as your exit level.

Zooming in on HZNP on
daily chart. We draw the daily levels . As you can see from the image
below, we have different resistance level and one support level where we
would be interested in
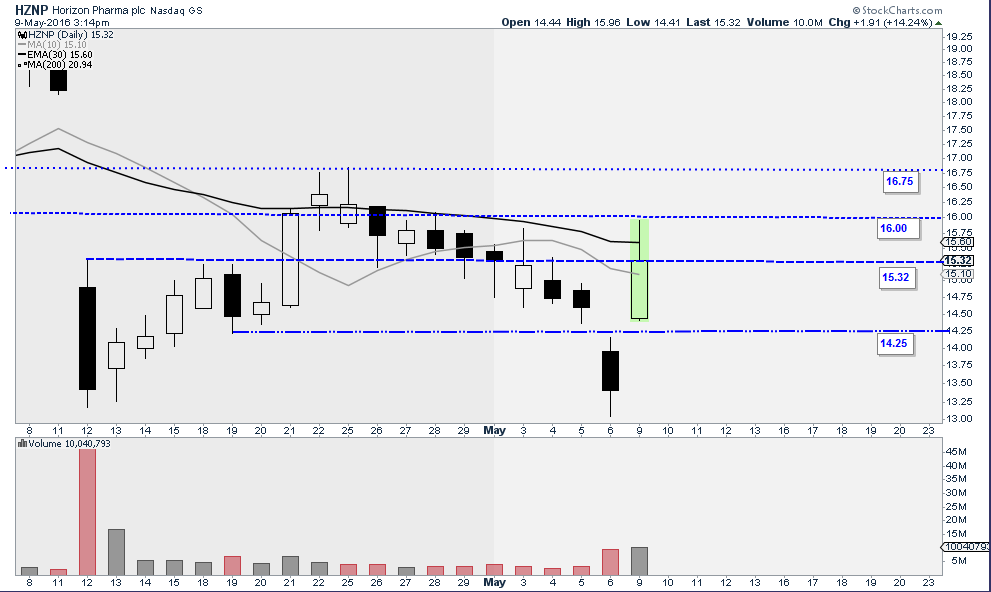
Entry - Looking for an entry 14.25 and 14.50 level.
Exit - First exit.. would be at 15.30 level and next one 15.80 level and also 16.75. But all depends on price action i.e.. is it showing strength and do you see any reversal candles. "Let the winners run unless proven wrong"
Indicators - Ema's and Vwap were rising during pre-market, although near the open there was a bit of consolidation. But never the less they never showed any downtrend movement.Ideal you want you see them rising and price holding.
Chart to use when trading will be both 2min and 5 min chart. 2 Min will be for timing entry and 5 Min will be for management.Why? As you can see below. 5 min chart showed strength but did not give an entry signal, but 2 min on the other hand had a pullback that offered an entry.
Chart to use when trading will be both 2min and 5 min chart. 2 Min will be for timing entry and 5 Min will be for management.Why? As you can see below. 5 min chart showed strength but did not give an entry signal, but 2 min on the other hand had a pullback that offered an entry.

